阅读分析虚拟机和垃圾收集器的日志是处理Java虚拟机内存问题必备的基础技能,垃圾收集器日志是一系列人为设定的规则,多少有点随开发者编码时的心情而定,没有任何的“业界标准”可言,换句话说,每个收集器的日志格式都可能不一样。除此以外还有一个麻烦,在JDK 9以前,HotSpot并没有提供统一的日志处理框架,虚拟机各个功能模块的日志开关分布在不同的参数上,日志级别、循环日志大小、输出格式、重定向等设置在不同功能上都要单独解决。直到JDK 9,这种混乱不堪的局面才终于消失,HotSpot所有功能的日志都收归到了“-Xlog”参数上,这个参数的能力也相应被极大拓展了:
1 -Xlog[:[selector][:[output][:[decorators][:output-options]]]]
命令行中最关键的参数是选择器(Selector),它由标签(Tag)和日志级别(Level)共同组成。 标签可理解为虚拟机中某个功能模块的名字,它告诉日志框架用户希望得到虚拟机哪些功能的日志输出。垃圾收集器的标签名称为“gc”,由此可见,垃圾收集器日志只是HotSpot众多功能日志的其中一项,全部支持的功能模块标签名如下所示:
1 add,age,alloc,annotation,aot,arguments,attach,barrier,biasedlocking,blocks,bot,breakpoint,bytecode,census,class,classhisto,cleanup,compaction,comparator,constraints,constantpool,coops,cpu,cset,data,defaultmethods,dump,ergo,event,exceptions,exit,fingerprint,freelist,gc,hashtables,heap,humongous,ihop,iklass,init,itables,jfr,jni,jvmti,liveness,load,loader,logging,mark,marking,metadata,metaspace,method,mmu,modules,monitorinflation,monitormismatch,nmethod,normalize,objecttagging,obsolete,oopmap,os,pagesize,parser,patch,path,phases,plab,preorder,promotion,protectiondomain,purge,redefine,ref,refine,region,remset,resolve,safepoint,scavenge,scrub,setting,stackmap,stacktrace,stackwalk,start,startuptime,state,stats,stringdedup,stringtable,subclass,survivor,sweep,system,task,thread,time,timer,tlab,unload,update,verification,verify,vmoperation,vtables,workgang
日志级别从低到高,共有Trace,Debug,Info,Warning,Error,Off六种级别,日志级别决定了输出信息的详细程度,默认级别为Info,HotSpot的日志规则与Log4j、SLF4j这类Java日志框架大体上是一致的。另外,还可以使用修饰器(Decorator)来要求每行日志输出都附加上额外的内容,支持附加在日志行上的信息包括:
time:当前日期和时间。
uptime:虚拟机启动到现在经过的时间,以秒为单位。
timemillis:当前时间的毫秒数,相当于System.currentTimeMillis()的输出。
uptimemillis:虚拟机启动到现在经过的毫秒数。
timenanos:当前时间的纳秒数,相当于System.nanoTime()的输出。
uptimenanos:虚拟机启动到现在经过的纳秒数。
pid:进程ID。
tid:线程ID。
level:日志级别。
tags:日志输出的标签集。
如果不指定,默认值是uptime、level、tags这三个,此时日志输出类似于以下形式:
1 [3.080s][info][gc,cpu] GC(5) User=0.03s Sys=0.00s Real=0.01s
下面笔者举几个例子,展示在JDK 9统一日志框架前、后是如何获得垃圾收集器过程的相关信息,以下均以JDK 9的G1收集器(JDK 9下默认收集器就是G1,所以命令行中没有指定收集器)为例。
1)查看GC基本信息,在JDK 9之前使用-XX:+PrintGC,JDK 9后使用-Xlog:gc:
1
2
3
4
5
bash-3.2$ java -Xlog:gc GCTest [0.222s][info][gc] Using G1 [2.825s][info][gc] GC(0) Pause Young (G1 Evacuation Pause) 26M->5M(256M) 355.623ms [3.096s][info][gc] GC(1) Pause Young (G1 Evacuation Pause) 14M->7M(256M) 50.030ms [3.385s][info][gc] GC(2) Pause Young (G1 Evacuation Pause) 17M->10M(256M) 40.576ms
2)查看GC详细信息,在JDK 9之前使用-XX:+PrintGCDetails,在JDK 9之后使用-X-log:gc, 用通配符 将GC标签下所有细分过程都打印出来,如果把日志级别调整到Debug或者Trace(基于版面篇幅考虑,例子中并没有),还将获得更多细节信息:
1
2
3
4
5
6
7
8
9
10
11
12
13
14
15
16
17
18
19
20
21
22
23
24
25
26
27
28
29
30
31
bash-3.2$ java -Xlog:gc* GCTest [0.233s][info][gc,heap] Heap region size: 1M [0.383s][info][gc ] Using G1 [0.383s][info][gc,heap,coops] Heap address: 0xfffffffe50400000, size: 4064 MB, Compressed Oops mode: Non-zero based: 0xfffffffe50000000, Oop shift amount: 3 [3.064s][info][gc,start ] GC(0) Pause Young (G1 Evacuation Pause) gc,task ] GC(0) Using 23 workers of 23 for evacuation [3.420s][info][gc,phases ] GC(0) Pre Evacuate Collection Set: 0.2ms [3.421s][info][gc,phases ] GC(0) Evacuate Collection Set: 348.0ms gc,phases ] GC(0) Post Evacuate Collection Set: 6.2ms [3.421s][info][gc,phases ] GC(0) Other: 2.8ms gc,heap ] GC(0) Eden regions: 24->0(9) [3.421s][info][gc,heap ] GC(0) Survivor regions: 0->3(3) [3.421s][info][gc,heap ] GC(0) Old regions: 0->2 [3.421s][info][gc,heap ] GC(0) Humongous regions: 2->1 [3.421s][info][gc,metaspace ] GC(0) Metaspace: 4719K->4719K(1056768K) [3.421s][info][gc ] GC(0) Pause Young (G1 Evacuation Pause) 26M->5M(256M) 357.743ms [3.422s][info][gc,cpu ] GC(0) User=0.70s Sys=5.13s Real=0.36s [3.648s][info][gc,start ] GC(1) Pause Young (G1 Evacuation Pause) [3.648s][info][gc,task ] GC(1) Using 23 workers of 23 for evacuation [3.699s][info][gc,phases ] GC(1) Pre Evacuate Collection Set: 0.3ms gc,phases ] GC(1) Evacuate Collection Set: 45.6ms gc,phases ] GC(1) Post Evacuate Collection Set: 3.4ms gc,phases ] GC(1) Other: 1.7ms gc,heap ] GC(1) Eden regions: 9->0(10) [3.699s][info][gc,heap ] GC(1) Survivor regions: 3->2(2) [3.699s][info][gc,heap ] GC(1) Old regions: 2->5 [3.700s][info][gc,heap ] GC(1) Humongous regions: 1->1 [3.700s][info][gc,metaspace ] GC(1) Metaspace: 4726K->4726K(1056768K) [3.700s][info][gc ] GC(1) Pause Young (G1 Evacuation Pause) 14M->7M(256M) 51.872ms [3.700s][info][gc,cpu ] GC(1) User=0.56s Sys=0.46s Real=0.05s
3)查看GC前后的堆、方法区可用容量变化,在JDK 9之前使用-XX:+PrintHeapAtGC,JDK 9之 后使用-Xlog:gc+heap=debug:
1
2
3
4
5
6
7
8
9
10
11
12
13
14
15
16
17
18
bash-3.2$ java -Xlog:gc+heap=debug GCTest [0.113s][info][gc,heap] Heap region size: 1M [0.113s][debug][gc,heap] Minimum heap 8388608 Initial heap 268435456 Maximum heap 4261412864 [2.529s][debug][gc,heap] GC(0) Heap before GC invocations=0 (full 0): [2.529s][debug][gc,heap] GC(0) garbage-first heap total 262144K, used 26624K [0xfffffffe50400000, 0xfffffffe50500800, 0xffffffff4e400000) [2.529s][debug][gc,heap] GC(0) region size 1024K, 24 young (24576K), 0 survivors (0K) [2.530s][debug][gc,heap] GC(0) Metaspace used 4719K, capacity 4844K, committed 5120K, reserved 1056768K [2.530s][debug][gc,heap] GC(0) class space used 413K, capacity 464K, committed 512K, reserved 1048576K [2.892s][info ][gc,heap] GC(0) Eden regions: 24->0(9) [2.892s][info ][gc,heap] GC(0) Survivor regions: 0->3(3) [2.892s][info ][gc,heap] GC(0) Old regions: 0->2 [2.892s][info ][gc,heap] GC(0) Humongous regions: 2->1 [2.893s][debug][gc,heap] GC(0) Heap after GC invocations=1 (full 0): [2.893s][debug][gc,heap] GC(0) garbage-first heap total 262144K, used 5850K [0xfffffffe50400000, 0xfffffffe50500800, 0xffffffff4e400000) [2.893s][debug][gc,heap] GC(0) region size 1024K, 3 young (3072K), 3 survivors (3072K) [2.893s][debug][gc,heap] GC(0) Metaspace used 4719K, capacity 4844K, committed 5120K, reserved 1056768K [2.893s][debug][gc,heap] GC(0) class space used 413K, capacity 464K, committed 512K, reserved 1048576K
4)查看GC过程中用户线程并发时间以及停顿的时间,在JDK 9之前使用-XX:+Print- GCApplicationConcurrentTime以及-XX:+PrintGCApplicationStoppedTime,JDK 9之后使用-Xlog: safepoint:
1
2
3
4
5
6
7
bash-3.2$ java -Xlog:safepoint GCTest [1.376s][info][safepoint] Application time: 0.3091519 seconds [1.377s][info][safepoint] Total time for which application threads were stopped: 0.0004600 seconds, Stopping threads took: 0.0002648 seconds [2.386s][info][safepoint] Application time: 1.0091637 seconds [2.387s][info][safepoint] Total time for which application threads were stopped: 0.0005217 seconds, Stopping threads took: 0.0002297 seconds
5)查看收集器Ergonomics机制(自动设置堆空间各分代区域大小、收集目标等内容,从Parallel收集器开始支持)自动调节的相关信息。在JDK 9之前使用-XX:+PrintAdaptive-SizePolicy,JDK 9之后使用-Xlog:gc+ergo*=trace:
1
2
3
4
5
6
7
8
9
10
11
12
13
bash-3.2$ java -Xlog:gc+ergo*=trace GCTest [0.122s][debug][gc,ergo,refine] Initial Refinement Zones: green: 23, yellow: 69, red: 115, min yellow size: 46 [0.142s][debug][gc,ergo,heap ] Expand the heap. requested expansion amount:268435456B expansion amount:268435456B [2.475s][trace][gc,ergo,cset ] GC(0) Start choosing CSet. pending cards: 0 predicted base time: 10.00ms remaining time: 190.00ms target pause time: 200.00ms [2.476s][trace][gc,ergo,cset ] GC(0) Add young regions to CSet. eden: 24 regions, survivors: 0 regions, predicted young region time: 367.19ms, target pause time: 200.00ms [2.476s][debug][gc,ergo,cset ] GC(0) Finish choosing CSet. old: 0 regions, predicted old region time: 0.00ms, time remaining: 0.00 [2.826s][debug][gc,ergo ] GC(0) Running G1 Clear Card Table Task using 1 workers for 1 units of work for 24 regions. [2.827s][debug][gc,ergo ] GC(0) Running G1 Free Collection Set using 1 workers for collection set length 24 [2.828s][trace][gc,ergo,refine] GC(0) Updating Refinement Zones: update_rs time: 0.004ms, update_rs buffers: 0, update_rs goal time: 19.999ms
6)查看熬过收集后剩余对象的年龄分布信息,在JDK 9前使用-XX:+PrintTenuring-Distribution, JDK 9之后使用-Xlog:gc+age=trace:
1
2
3
4
5
6
7
8
bash-3.2$ java -Xlog:gc+age=trace GCTest [2.406s][debug][gc,age] GC(0) Desired survivor size 1572864 bytes, new threshold 15 (max threshold 15) [2.745s][trace][gc,age] GC(0) Age table with threshold 15 (max threshold 15) [2.745s][trace][gc,age] GC(0) - age 1: 3100640 bytes, 3100640 total [4.700s][debug][gc,age] GC(5) Desired survivor size 2097152 bytes, new threshold 15 (max threshold 15) [4.810s][trace][gc,age] GC(5) Age table with threshold 15 (max threshold 15) [4.810s][trace][gc,age] GC(5) - age 1: 2658280 bytes, 2658280 total [4.810s][trace][gc,age] GC(5) - age 2: 1527360 bytes, 4185640 total
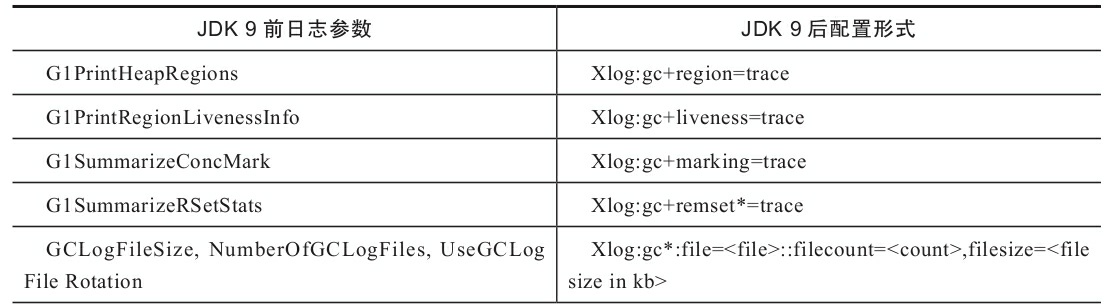
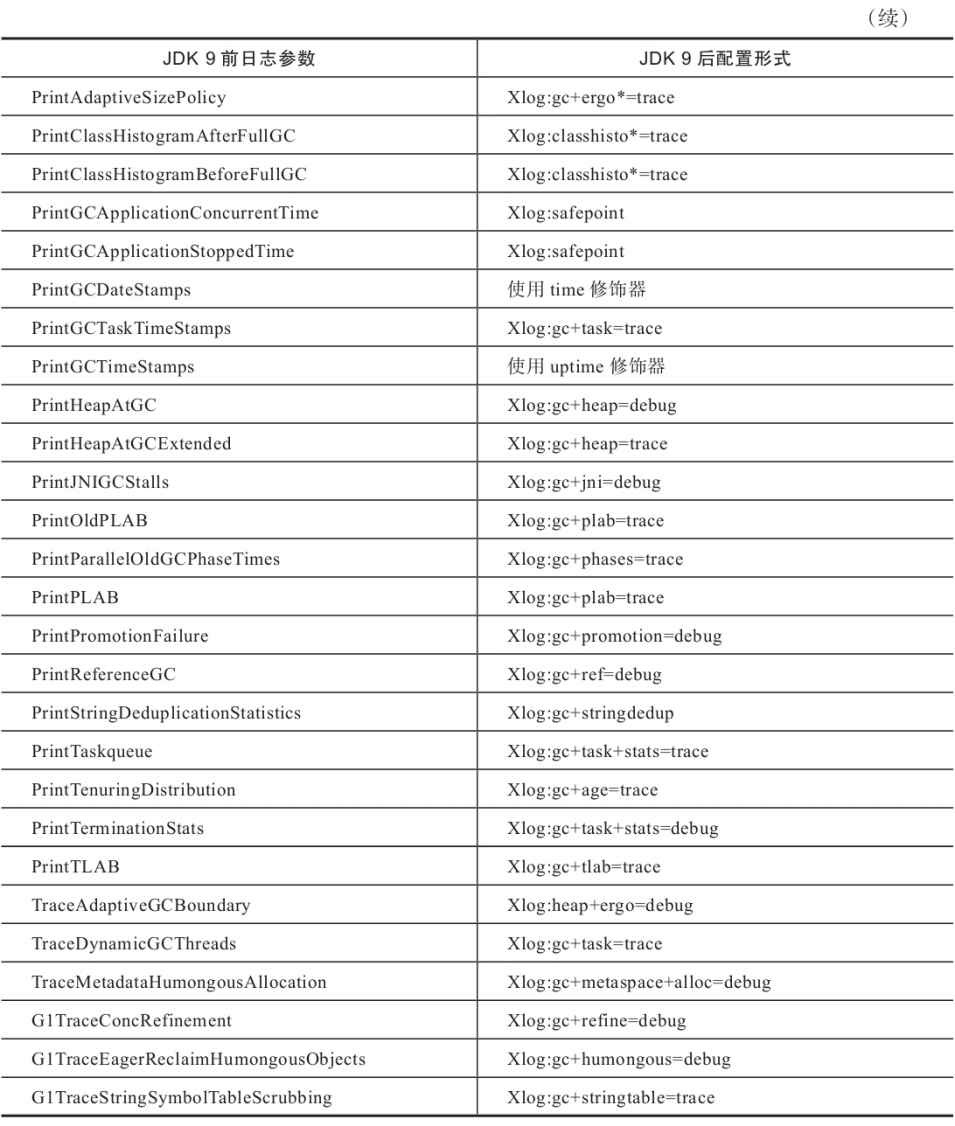
囿于篇幅原因,不再一一列举,表3-3给出了全部在JDK 9中被废弃的日志相关参数及它们在JDK 9后使用-Xlog的代替配置形式。
表3-3 JDK 9前后日志参数变化